Phylogeny
What is Phylogeny?
Phylogeny is by definition the history of the evolution of a species or group, especially in reference to lines of descent and relationships among broad groups of organisms.
Phylogeny is by definition the history of the evolution of a species or group, especially in reference to lines of descent and relationships among broad groups of organisms.
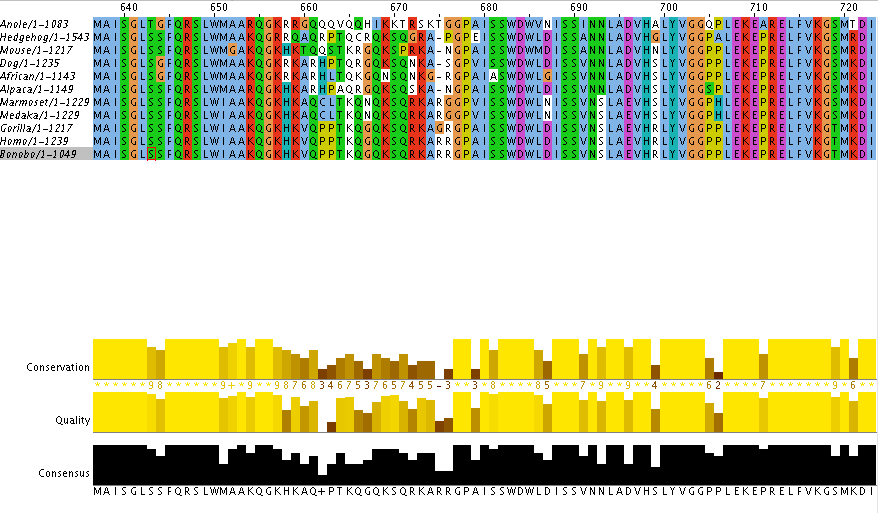
The figure above is from ClustalOmega program that aligns the protein sequences of each organism. Because many species have a variety in the number of amino acids in the same gene, each amino acid might not line up perfectly and we may see breaks or spaces between the amino acids. This is shown above by the dashes. In a sequence above if the amino acids are completely lined up across all of our organisms you will see a column with an individual color. This signifies that we have a "conserved" sequence in that particular area of the sequence.
Phylogenetic Trees
Phylogenetic trees or also known as evolutionary trees are a branching diagram or "tree" that shows the evolutionary relationships between biological species by using their phylogeny. Below we used the tree system in a slightly different approach by using the average distance and neighbor joining with % identity and BLOSUM62. The organisms joined together in the tree are shown to be more closely related to each other and share a more common protein sequence from the initial POLG gene thats shared between all the organisms.
The trees below are separated into 4 different categories of comparisons:
1. BLOSUM Matrix
The BLOSUM Matrix uses a type of scoring system that projects the similarity between the proteins. The BLOSUM matrix compares the amino acids when they are lined up to each other and then determines the similarity. The score is based off of the very conserved regions of our proteins and then the system counts the relative frequencies of amino acids along with the substitution probabilities. Then they calculate a "log-odds" score for each of the possible substitution pairs of amino acids.
2. Percent Identity
Percent identity is calculated by multiplying the number of amino acid matches compared from each protein sequence by 100 and then dividing by the length of the aligned region including gaps in the sequences. Perfect Identity scoring only counts perfect matches in the sequences and doesn't include how similar amino acids are to each other. Only the internal gaps are included in the length and the gaps at the sequence ends are not.
3. Neighbor Joining
This method uses a type of algorithm that essentially takes the similarity scores found via BLOSUM or Percent Identity and then uses them to identify how closely related each protein sequence is to another. After these scores are found it calculates when the two organisms diverged and creates that distance from the similarities in score.
4. Average Distance
This method assumes that the proteins from each organism diverged from a common ancestor. Then it uses the scores found from Percent Identity and BLOSUM Matrix to calculate how closely related they are to each other and then joins them with equal branch lengths.
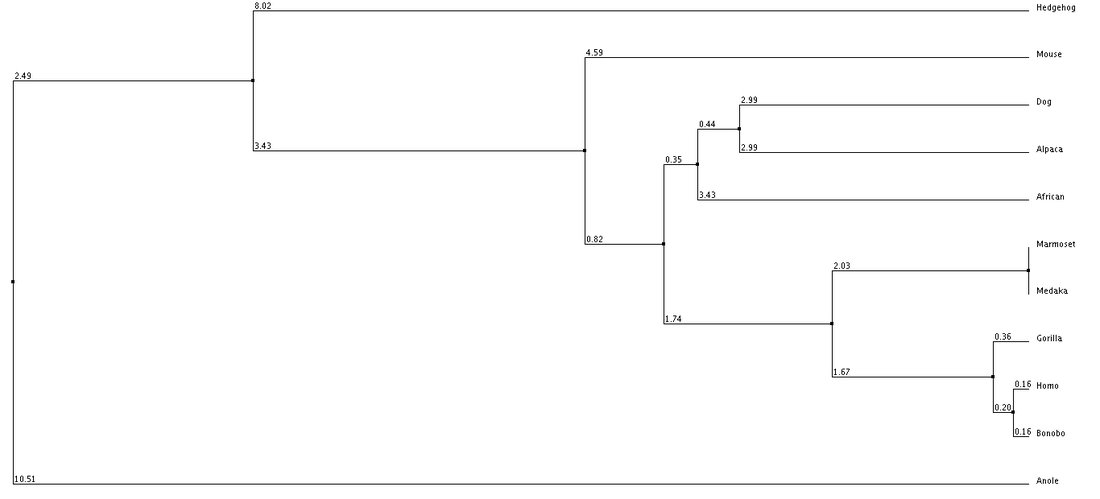
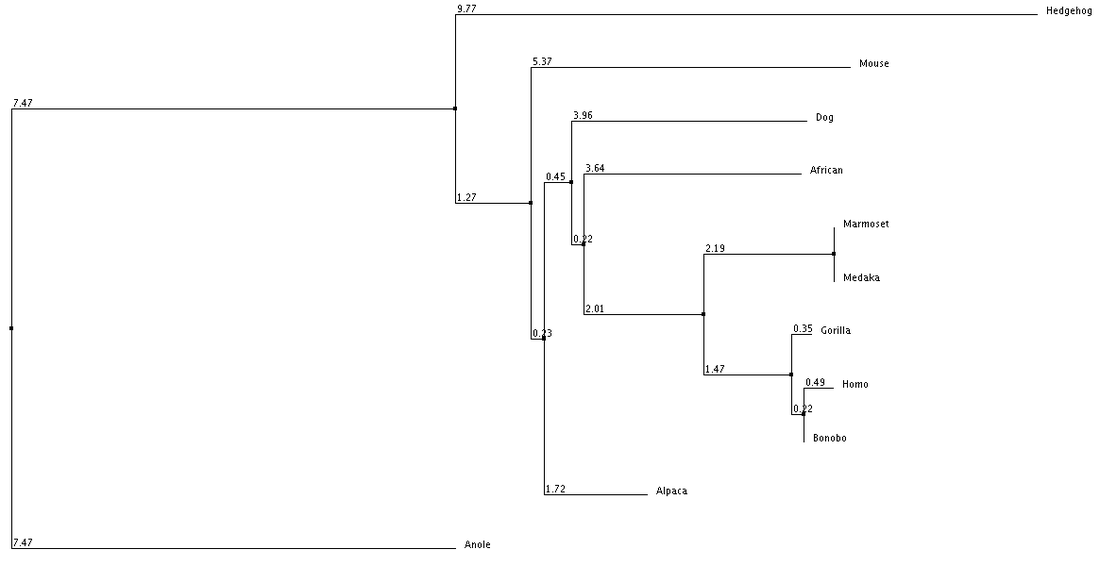
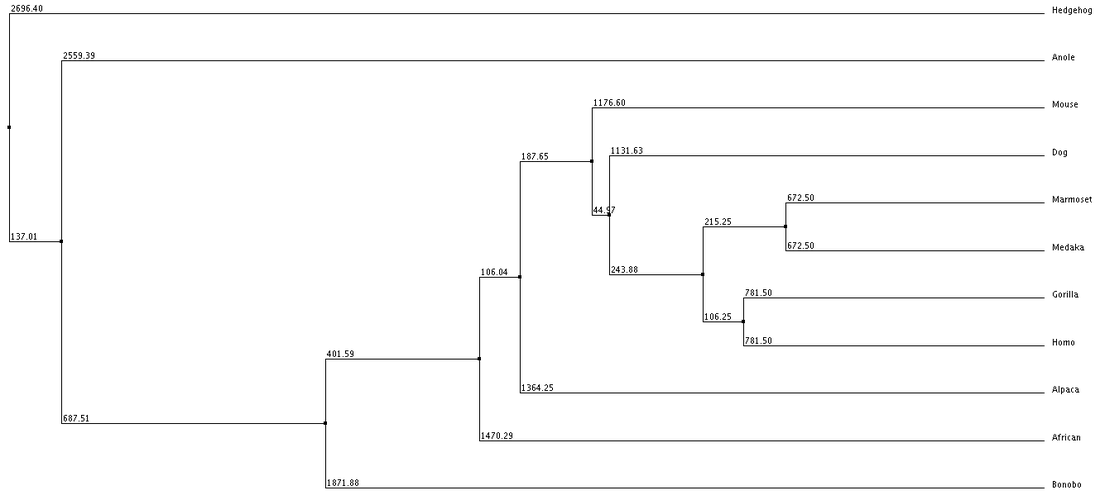
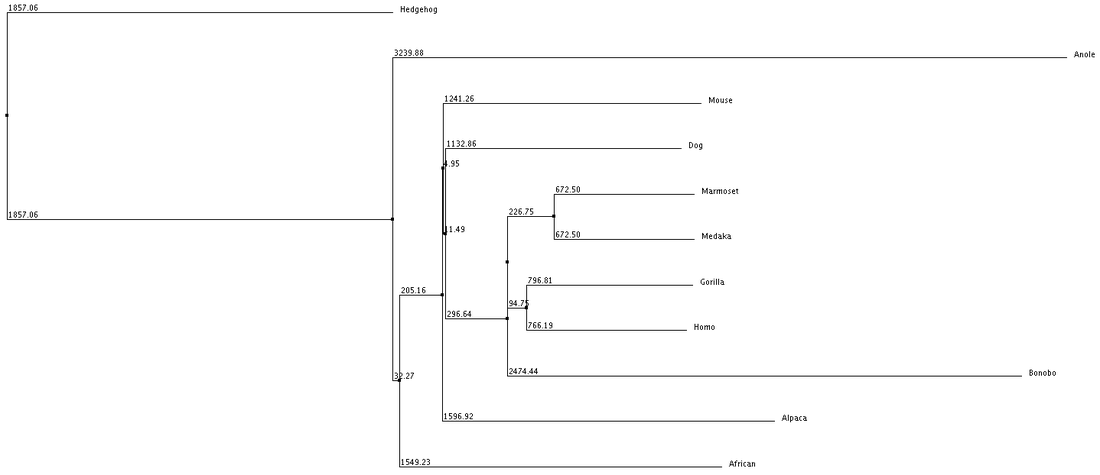
1. Average Distance using % Identity 2. Neighbor Joining with % Identity 3. Average Distance with BLOSUM62 4. Neighbor Joining with BLOSUM62
Analysis
We can see from our phylogenic trees that Bonobos, Humans and Gorillas are the most closely related in terms of protein sequence. This follows the trend of how closely our species are related. Trees 1, 2 and 4 reflect this the most accurately. Tree 3 seems to diverge from this trend and the fact that it uses average distance doesn't help show the relatedness since the branch length is equal with all organisms. However we do see that these organisms show similar divergence. These trees paired with the ClustalOmega image show how conserved the sequence is across all of the organisms. From this we can conclude that this sequence highly regulated due to the critical importance this has upon the cell and cell function.
Sequences used for the Analysis
| homologs.pdf |
References
- "Bioinformatics Lesson 3 -- Pairwise Alignment, Part 2." Bioinformatics Lesson 3 -- Pairwise Alignment, Part 2. VIBE Education Edition, n.d. Web. 25 Mar. 2015.
- "Calculation of Percent Identity." DNAStar. MegAlign Help, n.d. Web. 25 Mar. 2015.
- "Tree Calculation." Tree Calculation. Jalview, n.d. Web. 25 Mar. 2015.
